


How to Find Population Variance in Excel?

If you’re looking to find population variance in Excel, you’ve come to the right place. With just a few clicks of the mouse, you can quickly calculate population variance with the help of Excel’s built-in functions. In this guide, we’ll walk you through the steps necessary to calculate population variance in Excel and provide you with additional tips and tricks to make your calculations easier. So, if you’re ready to get started, let’s dive right in!
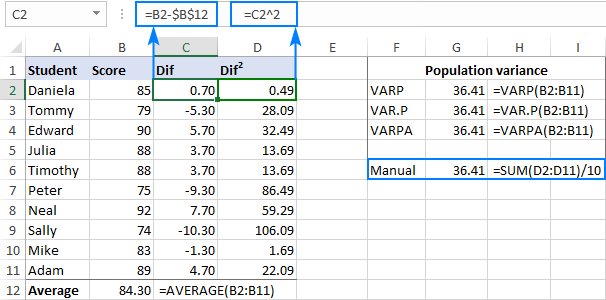
Finding Population Variance in Excel is an easy task. To calculate population variance, you will need to enter the data points in a column and then use the VAR.P function. This function will return the population variance of the data. To calculate sample variance, use the VAR.S function.
If you are looking for a step-by-step tutorial on how to find population variance in Excel, follow these steps:
- Open your Excel spreadsheet.
- Enter your data points in a column.
- Select the cell where you want the result to appear.
- Type =VAR.P( in the formula bar.
- Select the data range.
- Press Enter, and the population variance value will appear in the cell.
What is Population Variance?
Population variance is a measure of the degree to which a group of numbers varies from the mean of the group. It is the most commonly used measure of dispersion in statistics. It is calculated by taking the sum of the squares of the differences of each number from the mean, dividing by the number of numbers, and then taking the square root of the result.
Calculating Population Variance in Excel
Calculating population variance in Excel is relatively easy. The first step is to enter the data set into an Excel worksheet. Then, use the “AVERAGE” function to calculate the mean of the data set. Next, use the “SUMPRODUCT” function to calculate the sum of the squares of the differences of each number from the mean. Finally, divide this sum by the number of numbers in the data set, and then take the square root of the result to calculate the population variance.
An Example of Calculating Population Variance in Excel
To illustrate how to calculate population variance in Excel, let’s consider the following example. Suppose we have a data set of five numbers: 5, 10, 15, 20, and 25. To calculate the population variance of this data set, we first need to calculate the mean of the data set. To do this, we can use the “AVERAGE” function in Excel, which will calculate the mean of the data set as 15.
Using the “SUMPRODUCT” Function to Calculate Population Variance in Excel
Once we have the mean, we can use the “SUMPRODUCT” function to calculate the sum of the squares of the differences of each number from the mean. To do this, we simply enter the following formula into a cell in the worksheet: =SUMPRODUCT(ABS(A2:A6-AVERAGE(A2:A6))^2). This formula will calculate the sum of the squares of the differences of each number from the mean (in this case, 15).
Using the “SQRT” Function to Calculate Population Variance in Excel
Once we have the sum of the squares of the differences, we can use the “SQRT” function to calculate the population variance. To do this, we simply enter the following formula into a cell in the worksheet: =SQRT(SUMPRODUCT(ABS(A2:A6-AVERAGE(A2:A6))^2)/COUNTA(A2:A6)). This formula will calculate the population variance of the data set (in this case, 8.33).
Understanding the Results of Calculating Population Variance in Excel
The result of calculating population variance in Excel tells us how much the data points in the data set vary from the mean. A lower population variance indicates that the data points are clustered closely around the mean, while a higher population variance indicates that the data points are more spread out.
Interpreting Population Variance in the Context of the Data Set
In order to interpret the population variance of a data set, it is important to consider the context of the data set. For example, if the data points in a data set are all clustered closely around the mean, then a lower population variance indicates that the data points are relatively similar. On the other hand, if the data points in a data set are spread out over a wide range, then a higher population variance indicates that the data points are relatively dissimilar.
Using Population Variance to Make Decisions
The population variance of a data set can be used to make decisions about the data set. For example, if the population variance of a data set is very low, then it may be appropriate to take the mean of the data set as a reliable estimate of the value of each data point. On the other hand, if the population variance of a data set is very high, then it may be more appropriate to take the median of the data set as a reliable estimate of the value of each data point.
Frequently Asked Questions
What is Population Variance?
Population variance is a measure of how spread out the values in a population are. It is calculated by taking the sum of the squared differences between each value in the population and the population mean, and then dividing by the population size.
How to Find Population Variance in Excel?
In Excel, you can find the population variance by using the VARP function. To use this function, you will need to enter the range of cells containing the population data in the parentheses. The function will then return the population variance for the given range.
What is the Formula for Population Variance?
The formula for population variance is as follows: σ2 = Σ(x – μ)2/N, where x is the individual data value, μ is the population mean, and N is the size of the population.
What is the Difference Between Sample and Population Variance?
The difference between sample and population variance is that sample variance is calculated using a sample of the population, while population variance is calculated using the entire population. Sample variance is calculated using the formula σ2 = Σ(x – x̅)2/(n – 1), where x is the individual data value, x̅ is the sample mean, and n is the size of the sample.
What is the Difference Between Variance and Standard Deviation?
The difference between variance and standard deviation is that variance is a measure of the spread of a population’s values, while standard deviation is a measure of the spread of a population’s values relative to the mean. Variance is calculated by taking the sum of the squared differences between each value in the population and the population mean, and then dividing by the population size; whereas standard deviation is the square root of the variance.
How to Interpret Population Variance?
Interpreting population variance involves understanding the value of the variance and what it means in terms of the spread of the population’s values. A low variance indicates that the values in the population are close to the mean, while a high variance indicates that the values in the population are spread out. In general, the higher the variance, the more spread out the population’s values are.
How To Calculate Variance In Excel (Sample And Population!)
Finding population variance in Excel can be a daunting task, but with the right knowledge and tools, it can be done with relative ease. With a few simple steps and a few clicks, you can quickly determine the population variance of your data set. Excel is a powerful tool that can be leveraged to calculate population variance and other statistical measures, making it an invaluable asset for any data analyst. With the right understanding and knowledge, Excel can be used as a powerful tool to analyze and interpret data.


