


How To Make Line Graph In Powerpoint?

Do you need to create an impressive line graph in PowerPoint for your presentation? It’s not as difficult as it seems! With the right tools, you can quickly create a professional-looking line graph that will help you make your point. In this article, we’ll guide you through the steps of how to make line graph in PowerPoint. You’ll be able to create a visually appealing and informative line graph in no time!
- Open Microsoft PowerPoint and select a blank presentation.
- Go to the Insert tab, click Charts, and select a line graph.
- Enter your data labels in the spreadsheet.
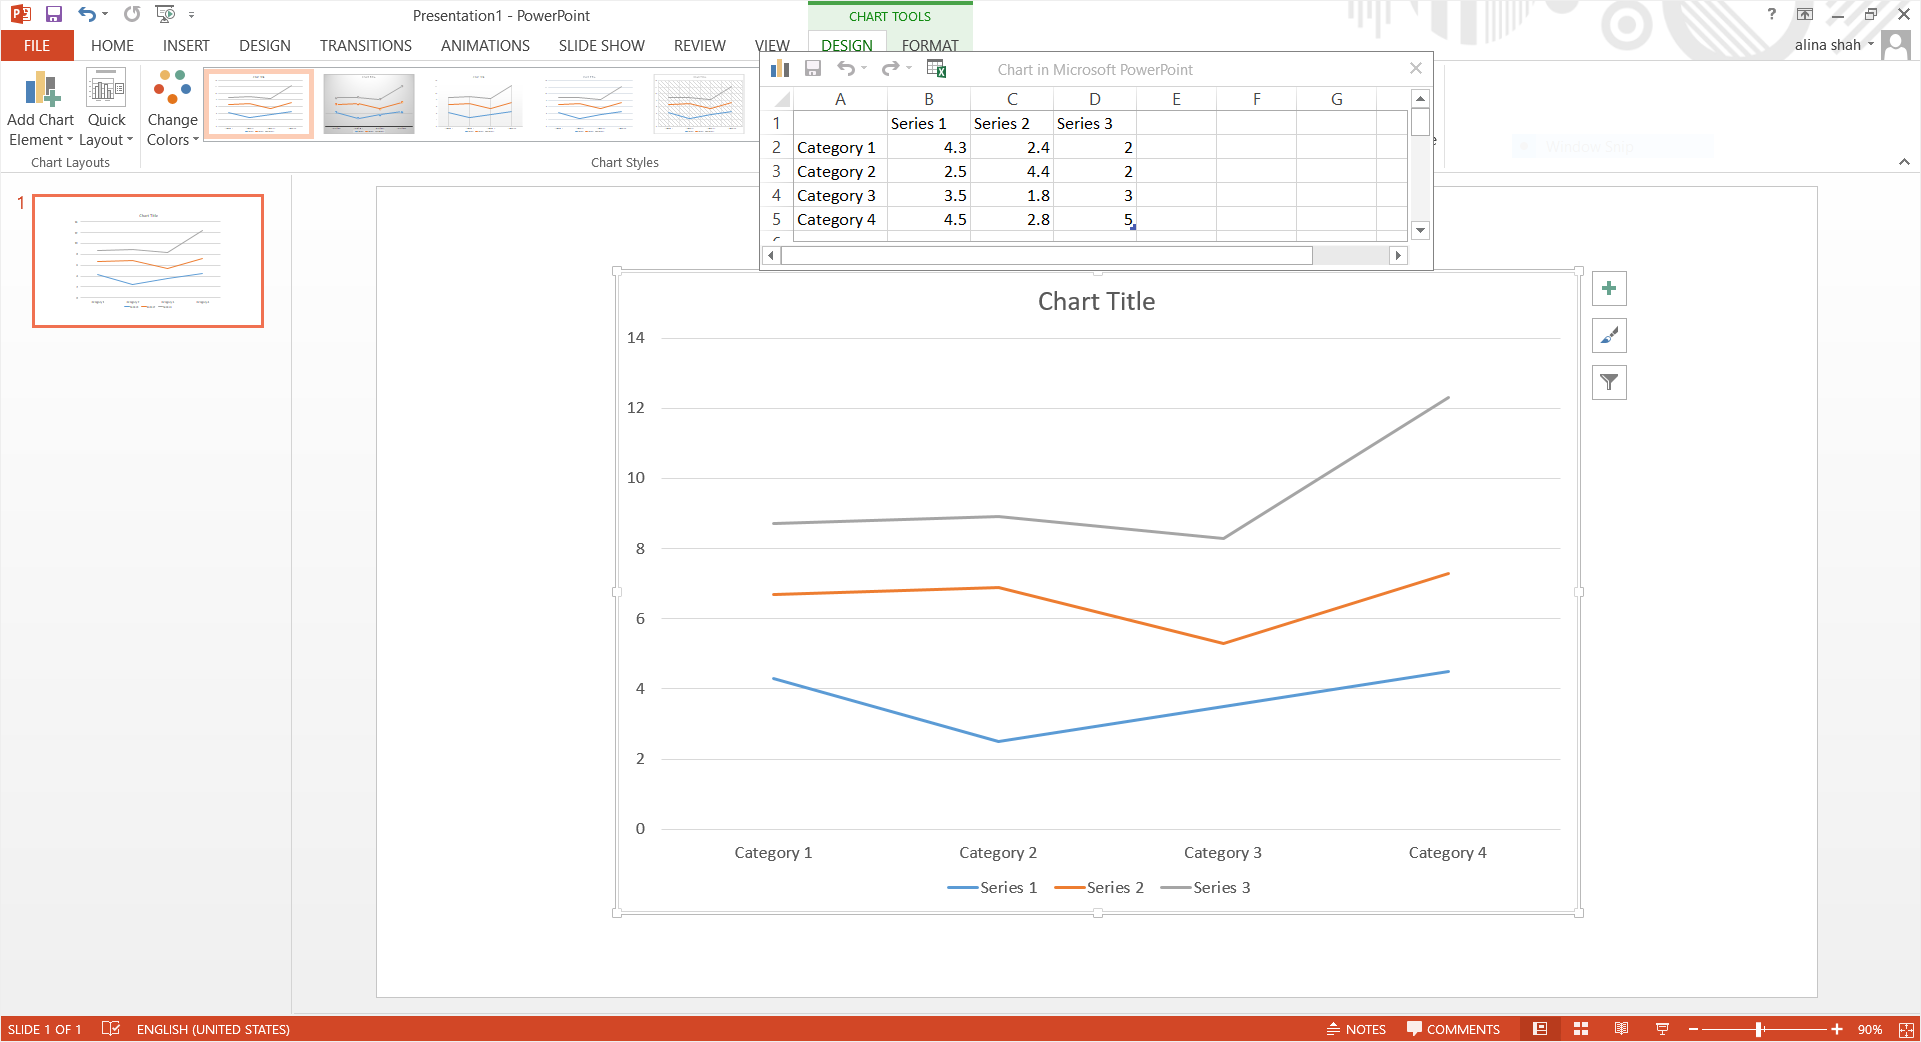
- Click the Design tab to add a chart title, axis titles, and a legend.
- Click the Format tab and choose an appropriate style.
- Click the Animations tab to add special effects to the graph.
- Go to the File menu and select Save As to save your line graph.
Introduction to How to Make Line Graphs in PowerPoint
Making a line graph in PowerPoint is a great way to communicate data points and illustrate trends. Line graphs are a type of chart used to show the change in data over a period of time. They are easy to create and can be used to highlight important information. In this article, we will go over how to make a line graph in PowerPoint so you can easily visualize your data.
Steps to Making a Line Graph in PowerPoint
Creating a line graph in PowerPoint is a simple process. All you need to do is follow these steps:
1. Collect Your Data
The first step to making a line graph in PowerPoint is to collect your data. This means gathering the information you want to display in your graph. Make sure that the data is accurate and up-to-date. Once you have collected your data, it’s time to move on to the next step.
2. Enter the Data into a Table
Once you have collected your data, you will need to enter it into a table. This makes it easier to format your data into a line graph. To do this, open a blank PowerPoint slide and create a table. Then, enter your data into the table. Make sure that the data is organized in a way that will make it easy to create the graph.
3. Insert a Line Graph
Once your data is entered into a table, you can insert a line graph. To do this, click on the “Insert” tab in the top menu. Then, click “Chart” and select “Line” from the list of chart types. This will open the “Insert Chart” window, which allows you to customize the look of your line graph.
Customizing the Line Graph
Once you have inserted the line graph, you can customize it to suit your needs. Here are some of the ways you can customize your line graph:
1. Change the Line Color and Style
You can change the line color and style of your line graph to make it more visually appealing. To do this, simply click on the line in the graph and select “Format” from the top menu. This will open the “Format Chart Area” window, which allows you to customize the line color and style.
2. Add Labels and Legends
You can also add labels and legends to your line graph to make it easier to understand. To do this, click on the “Chart” tab in the top menu and select “Add Labels” or “Add Legends.” This will open the “Add Labels” or “Add Legends” window, which allows you to customize the labels and legends for your graph.
Finalizing the Line Graph
Once you have customized your line graph, it’s time to finalize it. To do this, click on the “Chart” tab in the top menu and select “Finalize Chart.” This will open the “Finalize Chart” window, which allows you to add a title and other elements to your line graph.
Conclusion
Creating a line graph in PowerPoint is a simple and effective way to visualize your data. All you need to do is follow the steps outlined in this article and you can easily create a line graph that is both informative and visually appealing.
Frequently Asked Questions
What is a Line Graph?
A line graph is a type of graph that shows the changes in data over a specific period of time. The graph consists of a series of points connected by lines. Line graphs are used to represent data which changes over time and is useful for showing trends and comparing data points.
How to Create a Line Graph in Powerpoint?
Creating a line graph in Powerpoint is a simple process. First, select the data you want to graph. Then, click the Insert tab on the ribbon and select the Line Chart option. This will bring up a chart template. Next, enter your data in the chart template. Finally, customize the chart to your liking by changing the axes, labels, and colors.
What are the Different Types of Line Graphs?
There are several different types of line graphs. These include single line graphs, which have a single line that shows the changes in data over time; dual line graphs, which have two lines that show changes in two different datasets; and multiple line graphs, which have multiple lines that show changes in multiple datasets.
What are the Benefits of Using Line Graphs?
Line graphs are useful for quickly conveying information about changes in data over time. They are easy to understand and are visually appealing. Line graphs can also be used to compare multiple datasets, making them a powerful tool for data analysis.
What are the Disadvantages of Using Line Graphs?
Line graphs can be difficult to read if there are too many data points. Additionally, line graphs can be misleading if the axes are not labeled properly. Finally, line graphs should not be used to compare two different types of data, as this can lead to incorrect conclusions.
How to Add Labels to a Line Graph in Powerpoint?
Adding labels to a line graph in Powerpoint is a simple process. First, select the chart and click the Chart Layout tab on the ribbon. Then click the Axes option, and select the Horizontal or Vertical Axes option. This will bring up a window where you can enter labels for the axes. Finally, click the OK button to save the changes.
How To Create Line chart in PowerPoint
Making a line graph in Powerpoint is a great way to present data in a structured, organized, and visually appealing way. By following the steps outlined in this article, you can create a simple, clear line graph that is sure to stand out to your viewers. Whether you are presenting to a large group or a small one, your line graph will help to effectively communicate your message. So, don’t be afraid to take the time to learn how to create a line graph in Powerpoint. With a little bit of practice, you will be able to create impressive graphs that will help you get your point across.


