


How To Do Org Chart In Powerpoint?

Organizational charts are an essential tool for any business, and Powerpoint is a great way to create a professional looking org chart with minimal effort. In this article, we will discuss how to make an org chart in Powerpoint, what elements to include, and some tips to make your org chart look great. Whether you’re a beginner or an experienced Powerpoint user, this guide will help you create an effective org chart that will help your business succeed!
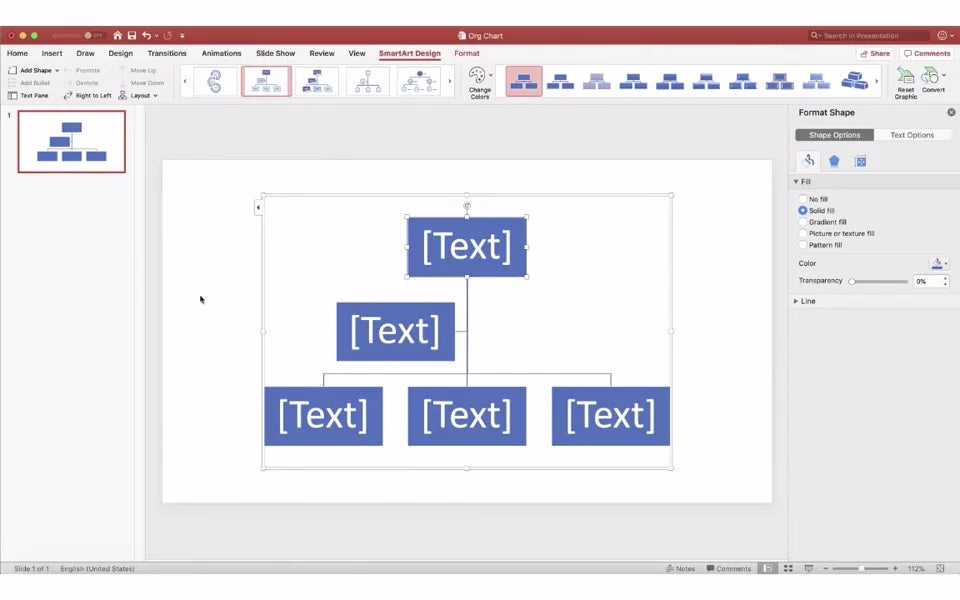
Creating an Organizational Chart in PowerPoint:
- Open Microsoft PowerPoint and select the “Insert” tab.
- Under the “Illustrations” section, click “SmartArt.”
- Choose the desired “Hierarchy” group and select the type of organizational chart.
- Input the text for each box in the organizational chart.
- To add another box, select the “Add Shape” menu and choose the desired option.
- To delete a box, select it and press the “Delete” key.
- To add a title to the chart, select the “Text Pane” and type the desired text.
- To apply a color to the chart, choose the “Design” tab and select the desired color.
- To save the chart, select the “File” menu and click “Save.”
Introduction to How to Create an Org Chart in PowerPoint
Creating an org chart in PowerPoint is a great way to visually represent the structure of a company or organization. It can help to communicate the roles and responsibilities of each team or individual, as well as the relationships between them. This tutorial will guide you through the process of creating an org chart in PowerPoint, from start to finish.
Steps to Create an Org Chart in PowerPoint
Step 1: Gather Information
The first step in creating an org chart in PowerPoint is to gather the necessary information. This includes the names of individuals, their roles, and the relationships between them. It’s also helpful to have a high-level understanding of the organizational structure and hierarchy. Once you have this information, you can begin to build your org chart.
Step 2: Choose a Template
The next step is to choose a template for your org chart. PowerPoint includes a variety of templates that can be used to create an org chart, or you can create your own custom template. If you’re using a template, make sure to customize it to fit your needs.
Step 3: Add Content
Now that you have a template, it’s time to add content to your org chart. Start by adding the names, roles, and relationships of each individual in the organization. This can be done by entering the information into the template or by manually adding shapes and text boxes.
Step 4: Format and Style
The next step is to format and style your org chart. This includes adding color, adjusting the size and placement of the shapes, and adding any other visual elements that you want to include.
Step 5: Finalize and Publish
Once you’ve finished formatting and styling your org chart, you can finalize it and publish it for others to view. To finalize your org chart, make sure to save it as a PowerPoint file. You can then share the file with others or publish it to the web.
Tips for Creating an Org Chart in PowerPoint
Keep it Simple
When creating an org chart in PowerPoint, it’s important to keep it simple. Stick to the basics and don’t get too fancy. The goal is to create an org chart that is easy to understand and conveys the necessary information.
Use Color Wisely
Color can be a powerful tool when creating an org chart. It can be used to draw attention to specific elements, group related items together, or differentiate between different roles or departments. However, it’s important to use color wisely. Too much color can be distracting and make the chart difficult to read.
Be Consistent
Consistency is key when creating an org chart. Make sure to use the same shapes, colors, and formatting for all elements of the chart. This will help ensure that the chart is easy to understand and conveys the information clearly.
Related Faq
What is an Org Chart?
An org chart is a diagram that shows the structure and hierarchy of an organization. It typically includes the names and positions of the organization’s leadership, and can be used to visualize the roles and responsibilities of each person in the organization.
What is the Purpose of an Org Chart?
The purpose of an org chart is to give a visual representation of the structure of an organization. It can be used to show the chain of command, identify areas of responsibility, and illustrate the relationships between departments and personnel. It is also useful for new employees to understand the different roles and responsibilities within the organization.
How Do I Create an Org Chart in Powerpoint?
Creating an org chart in PowerPoint can be done easily with the help of the SmartArt feature. First, insert a SmartArt graphic from the Insert tab. Then, select the type of org chart you want to create, such as a hierarchy, matrix, or cycle. After that, enter the text for each level of the org chart and customize the design of the chart.
What Customization Options are Available for Org Charts in Powerpoint?
PowerPoint offers a variety of customization options for org charts. You can add and remove shapes, change the color, add text, and add lines to connect shapes. You can also change the layout of the org chart, the size and position of shapes, and the font type, size, and color.
Are Org Charts in Powerpoint Easy to Share?
Yes, org charts in PowerPoint are easy to share. Once you have created the org chart, you can save the presentation as a PDF or PowerPoint file, or you can share it via email or a web link. You can also embed the org chart in a web page or blog post.
Can I Print an Org Chart From Powerpoint?
Yes, you can print an org chart from PowerPoint. First, select the Print option from the File menu. Then select the page size and orientation that you want to use. Finally, click the Print button to print the org chart. You can also save the org chart as a PDF file and print it from a PDF viewer.
Create Organization Chart in 2 Minutes | Power Point Tutorials
Creating an organizational chart in PowerPoint is a great way to visually display the structure of your business or organization. Whether you’re looking for a simple way to present your team, or you want to create a complex chart to demonstrate the hierarchy of a large organization, PowerPoint can help you do it in a few easy steps. With a few clicks, you can create an org chart that is both informative and visually appealing. So don’t wait any longer – get started today and create the perfect organizational chart for your business.


