


How to Find Sample Variance in Excel?

Are you looking to learn how to calculate sample variance in Excel? You’ve come to the right place! In this article, we’ll be exploring exactly how to find sample variance in Excel, from setting up the data to the final calculation. We’ll also discuss when and why sample variance is used and how to interpret the results. By the end of this article, you’ll be a pro at calculating sample variance in Excel. Let’s get started!
How to Find Sample Variance in Excel?
- Open the Excel spreadsheet with the data set
- Choose a cell for the sample variance calculation
- Write the formula
=VAR.S(data), replacing “data” with the range of cells containing the data set. This can include multiple rows and columns. - Press “Enter” to calculate the sample variance of the dataset
What is Sample Variance in Excel?
Sample Variance in Excel is a statistical measure that is used to assess the spread of a data set. It measures the degree to which individual observations within a data set are spread out from the mean value. Sample Variance is calculated by taking the sum of the squares of the differences between the individual values and the mean, dividing that by the number of observations minus one. Excel provides a built-in function for calculating Sample Variance, making it easy to calculate this value quickly and accurately.
How to Calculate Sample Variance in Excel?
Calculating Sample Variance in Excel is a straightforward process that requires only a few steps. First, enter the data set into a column in Excel. Then, select the cell where the sample variance should be calculated. To calculate the sample variance, enter the following formula into the selected cell: =VAR.S(data set). The VAR.S function will calculate the sample variance for the data set entered.
Once the VAR.S function is entered into the selected cell, it will return the sample variance for the data set. If the data set is changed, the sample variance will be automatically recalculated. This makes it easy to track changes in the sample variance for a given data set.
How to Use Sample Variance in Excel?
Sample Variance can be used to assess the spread of a data set. It is a useful tool for understanding the distribution of a data set, as it provides information about how far individual values are spread out from the mean.
In Excel, Sample Variance can be used to compare two or more data sets. This allows the user to quickly compare the spread of two or more data sets. Additionally, Sample Variance can be used in conjunction with other statistical functions, such as standard deviation, to better understand the distribution of a data set.
Example of Calculating Sample Variance in Excel
Step 1: Enter Data into a Column in Excel
First, enter the data set into a column in Excel. This can be done by manually entering the data into the column or by importing it from another source.
Step 2: Select Cell for Sample Variance
Next, select the cell where the sample variance should be calculated. This can be done by clicking on the desired cell or by using the arrow keys to navigate to the cell.
Step 3: Enter Sample Variance Formula into Selected Cell
Finally, enter the following formula into the selected cell: =VAR.S(data set). The VAR.S function will calculate the sample variance for the data set entered.
Advantages of Calculating Sample Variance in Excel
Ease of Use
Calculating Sample Variance in Excel is a straightforward process that requires only a few steps. Excel provides a built-in function for calculating Sample Variance, making it easy to calculate this value quickly and accurately.
Ability to Compare Data Sets
Sample Variance can be used to compare two or more data sets. This allows the user to quickly compare the spread of two or more data sets. Additionally, Sample Variance can be used in conjunction with other statistical functions, such as standard deviation, to better understand the distribution of a data set.
Frequently Asked Questions
Q1: What is Sample Variance?
Sample variance is a statistical measure used to quantify the spread of a dataset. It is calculated by taking the average of the squared differences between each element in the dataset and the mean. The sample variance is a measure of how far the data points in a sample set deviate from the average, and can be used to assess the reliability of a dataset.
Q2: How do you calculate Sample Variance in Excel?
Calculating sample variance in Excel is achieved by using the VAR.S() function. This function requires a single argument: the range of cells containing the data set. Once the range is defined, Excel will calculate the sample variance and display the result in the cell.
Q3: What is the Syntax for the VAR.S() Function?
The syntax for the VAR.S() function is VAR.S(range). The range is a reference to the data set used to calculate the sample variance. This can be a single row or column, or a range of cells.
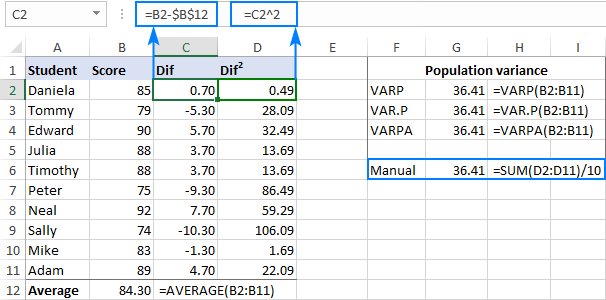
Q4: What is the Difference Between VAR and VAR.S?
The VAR() function calculates the population variance, while VAR.S() calculates the sample variance. The difference between these two functions is that the population variance takes into account the entire population of data points, while the sample variance only takes into account a sample set of data points.
Q5: What is a Good Value for Sample Variance?
A good value for sample variance will depend on the data set being used. Generally speaking, the lower the sample variance, the more reliable the data set is. This is because a low sample variance suggests that the data points are close to the average.
Q6: How Can Sample Variance be Used?
Sample variance can be used to assess the reliability of a dataset, as well as to compare datasets. When comparing datasets, a lower sample variance suggests that the two datasets are more similar than datasets with higher sample variances. It can also be used to identify outliers in a dataset, as outliers will have a large impact on the sample variance.
How to find sample variance in excel in under 2 minutes!
In conclusion, learning how to find sample variance in Excel can be a valuable and useful tool for any data analyst. With just a few simple steps, anyone can quickly and easily calculate sample variance in Excel. Knowing how to do this can help you better analyze data and make more informed decisions.


