


What is Standard Deviation in Excel?

Standard deviation, or SD, is a statistical measure that is widely used by researchers and analysts to quantify the amount of variation or dispersion in a dataset. In Microsoft Excel, there is a feature that allows users to easily calculate the standard deviation of a data set. In this article, we will discuss what standard deviation is, how to calculate it in Excel, and why it is an important tool.
What is Standard Deviation in Microsoft Excel?
Microsoft Excel is a powerful spreadsheet program that allows users to perform various calculations, including calculating standard deviation. Standard deviation is a measure of the spread of a set of data points around an average. It is a useful tool for understanding the distribution of a set of data and for comparing different sets of data.
Standard deviation is calculated by taking the square root of the variance of a set of numbers. The variance is the average of the squares of the differences between each data point and the average of the data set. To calculate the standard deviation in Excel, the “STDEV” function is used. This function takes a range of data points and returns the standard deviation of the set.
How to Calculate Standard Deviation in Excel
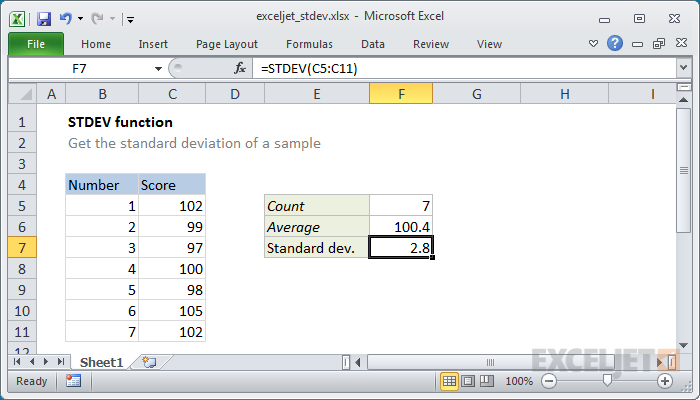
The first step in calculating the standard deviation in Excel is to enter the data set into the spreadsheet. Once the data is entered, select the range of data by clicking and dragging the mouse across the cells that contain the data. After the range is selected, click on the “Formulas” tab and select the “STDEV” function.
The next step is to enter the range of the data into the function. This is done by clicking on the cell that contains the data and dragging the mouse across the range. Once the range is entered, click “OK” and the standard deviation of the data set will be displayed in the cell. It is important to note that the range entered into the function must be the same size as the data set.
Interpreting the Results of Standard Deviation in Excel
The result of the standard deviation calculation in Excel is a single number. This number represents the spread of the data points around the average. A small standard deviation indicates that the data points are close to the average, while a large standard deviation indicates that the data points are spread out.
The standard deviation can also be used to compare different data sets. For example, if two data sets have the same average, but one has a larger standard deviation than the other, then the data set with the larger standard deviation has a greater spread around the average.
Standard Deviation in Excel vs. Statistics Software
Excel can be used to calculate the standard deviation of a data set, but it is limited in its ability to interpret the results. Statistics software, such as SPSS and SAS, are more powerful and can provide a more in-depth analysis of the data.
For example, statistics software can calculate the confidence interval of the standard deviation, which is the range of values that a given standard deviation is likely to fall within. Statistics software can also provide graphical representations of the data, such as histograms and box plots, that can help to visualize the spread and shape of the data.
Standard Deviation in Excel vs. Manual Calculation
Excel makes it easy to calculate the standard deviation of a data set, but it is possible to calculate it manually. The manual calculation involves taking the sum of the squares of the differences between each data point and the average of the data set, dividing it by the number of data points minus one, and then taking the square root of the result.
The manual calculation can be useful for understanding the mathematics behind the standard deviation calculation, but it is not as efficient as using Excel. For larger data sets, the manual calculation can be tedious and time consuming.
Uses of Standard Deviation in Excel
Standard deviation is a useful tool for understanding the spread of a data set and for comparing different data sets. It can be used to identify outliers in a data set, to compare the variability of different data sets, and to identify trends in a data set.
Standard deviation can also be used to check for data entry errors. For example, if the standard deviation of a data set is unusually high, it may indicate that some of the data points are incorrect. In this case, the data should be checked and any errors should be corrected.
Top 6 Frequently Asked Questions
What is Standard Deviation in Excel?
Standard deviation in Excel is a statistical measurement of the spread of data points in a data set. It is a measure of how far away each data point is from the mean of the data set. Standard deviation is often used to measure the volatility or risk of an investment or portfolio. It is also used to measure the accuracy of a forecast or model.
How is Standard Deviation Calculated in Excel?
Standard deviation in Excel is calculated using the STDEV.P function. This function takes a range of cells containing numeric values and calculates the standard deviation based on the entire population of those values. The formula for the STDEV.P function is STDEV.P(range of cells).
What is the Difference Between Standard Deviation and Variance in Excel?
The main difference between standard deviation and variance in Excel is that standard deviation measures the spread of data points from the mean while variance measures the average of the squared difference of each data point from the mean. Standard deviation is the square root of the variance.
What is an Example of Standard Deviation in Excel?
For example, if we have a data set of 10 values ranging from 1 to 10, the mean of this data set is 5.5. The standard deviation of this data set is calculated using the STDEV.P function and is equal to 3.027. This means that the data points are 3.027 units away from the mean on average.
Why is Standard Deviation Used in Excel?
Standard deviation is used in Excel to measure the volatility or risk of an investment or portfolio. It is also used to measure the accuracy of a forecast or model. By measuring the spread of data points from the mean, standard deviation can be used to provide insight into the risk associated with a particular investment or the accuracy of a forecast or model.
What is the Interpretation of Standard Deviation in Excel?
The interpretation of standard deviation in Excel depends on the context. Generally, a lower standard deviation indicates that the data points in a data set are closer to the mean, while a higher standard deviation indicates that the data points in a data set are further away from the mean. A low standard deviation indicates that the data points are more consistent, while a high standard deviation indicates that the data points are more variable.
Standard Deviation in Excel (NEW VERSION IN DESCRIPTION)
In conclusion, Standard Deviation in Excel is an effective tool used to measure the spread of a dataset around a central value. It is a great way to identify outliers, assess the risk associated with data points, and compare distributions. Furthermore, it can help you make better decisions and draw more accurate conclusions. With this powerful tool, you can make more informed decisions and become a better data analyst.


