


How to Find Y Intercept on Excel?

Do you want to learn how to quickly and accurately find the y-intercept on Excel? If so, you’ve come to the right place! In this article, we’ll discuss the simple steps to finding the y-intercept on Excel. We’ll cover how to use the “Trendline” and “Linear Regression” features to find the y-intercept, as well as how to calculate the y-intercept manually with basic math. With this comprehensive guide, you’ll be able to confidently calculate the y-intercept on Excel in no time!
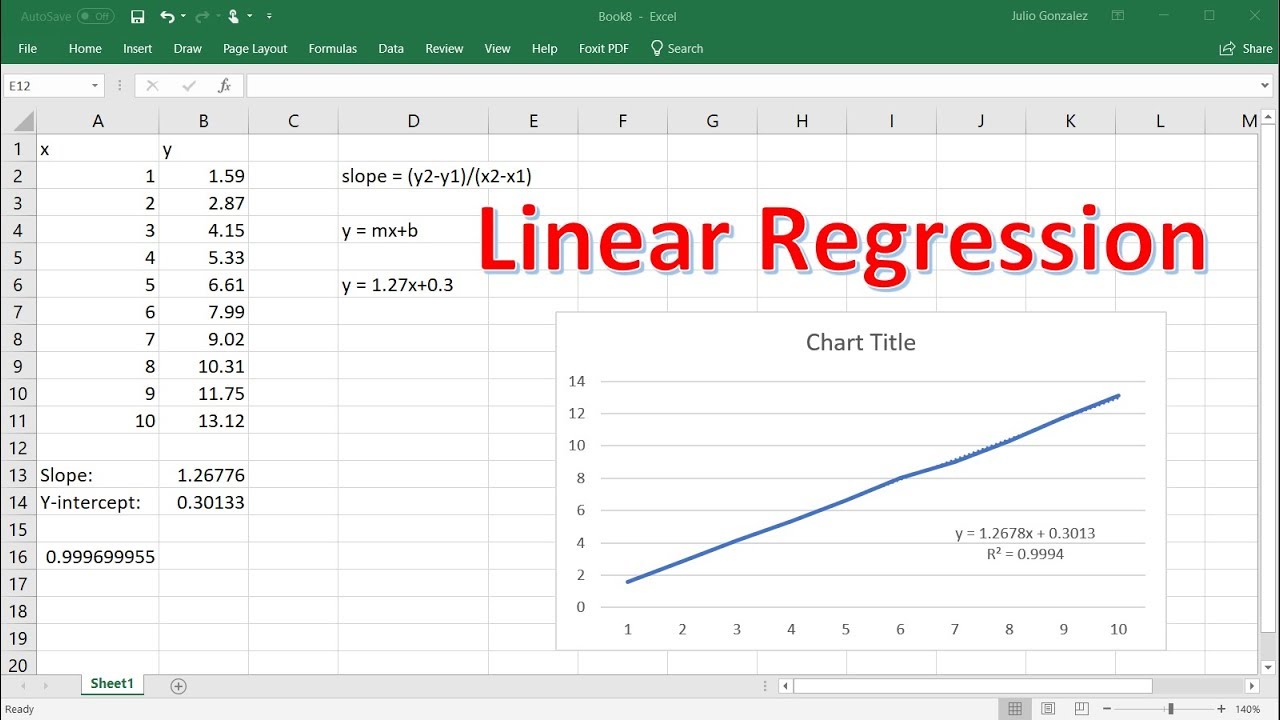
Finding the Y Intercept on Excel: Excel is a great tool for graphing data, and can easily help you find the Y Intercept of a line. To do this, first enter the data that you want to graph in two columns. Then, click the “Insert” tab and select “Scatter” under the “Charts” section. Now right-click on the chart and select “Add Trendline”. In the dialogue box, select “Linear” and check the box that says “Display equation on chart”. The Y Intercept will be the first number in the equation.
Finding the Y Intercept on Excel
The y intercept, also known as the “intercept point”, is a point on a graph that denotes where the line of a graph or equation intersects the Y-axis. It is a valuable point of information when working with equations or graphs in Excel, as it can provide crucial insight into the behavior of a given line. This article will provide step-by-step instructions on how to find the y intercept on Excel.
Calculating the Y Intercept from an Equation
If you have an equation written in the form of y=mx+b, then you can calculate the y intercept with relative ease. In this equation, “b” is the y intercept, so all you have to do is plug the equation into Excel and it will automatically give you the value of “b”. To do this, simply type the equation into the Excel cell, and then use the “solve” function to get the value of “b”.
If you do not have an equation written in the form of y=mx+b, then you will need to rewrite it in this form before you can calculate the y intercept. To do this, you will need to use algebraic manipulation.
Calculating the Y Intercept from a Graph
If you have a graph of the equation instead of the equation itself, then you will need to calculate the y intercept differently. To do this, you will first need to plot the graph in Excel. To do this, simply enter the x and y values into the appropriate cells, and then select “Graph” from the top menu. This will generate a graph of the equation.
Once you have the graph, you will need to identify the point at which the line intersects the Y-axis. This point is the y intercept. To get the exact value of the y intercept, simply click on the point at which the line intersects the Y-axis and Excel will display the exact value.
Using the Y Intercept in Excel
Once you have the y intercept, you can use it to calculate a wide variety of values. For example, you can use the y intercept to calculate the slope of the line (m) by subtracting the y intercept from the y value of the point on the line. You can also use the y intercept to calculate the area under the curve, or to calculate the length of the line.
Tips for Finding the Y Intercept
When calculating the y intercept, it is important to ensure that you are using the correct values. For example, if you are using an equation, make sure that you are using the original equation and not a simplified version. Similarly, if you are using a graph, make sure that the graph is accurate and that the points on the graph are correctly plotted.
It is also important to double-check your calculations. Excel is a powerful tool, but it is not infallible. It is always a good idea to double-check your calculations to make sure that they are correct.
Conclusion
Finding the y intercept on Excel is relatively simple, and can be done by either using an equation or by plotting a graph. However, it is important to make sure that you are using the correct values and to double-check your calculations to ensure accuracy.
Few Frequently Asked Questions
What is the y-intercept?
The y-intercept is the point at which a line crosses the y-axis in a graph. It is the value of y when x is equal to zero. It is also sometimes referred to as the “constant” since it is the value of y that remains the same regardless of the value of x.
How do I find the y-intercept in Excel?
To find the y-intercept in Excel, you can use the SLOPE and INTERCEPT functions. The SLOPE function returns the slope of the line when given two points, while the INTERCEPT function returns the y-intercept of the line when given the same two points. Both functions require two arguments, the x-values and y-values of two points.
How do I plot the y-intercept in Excel?
After finding the y-intercept, you can plot it in Excel. To do this, create a chart with the x-values and y-values of the two points that you used to find the y-intercept. Then, right-click on the chart and select “Add Trendline”. Select the “Linear” option and click “OK”. This will add a trendline to the chart that will be equivalent to the line you used to find the y-intercept.
What should I do if the y-intercept is negative?
If the y-intercept is negative, it means that the line crosses the y-axis below zero. This can be represented in an Excel chart by simply extending the trendline to the left of the x-axis.
Can I use the y-intercept to calculate the equation of a line?
Yes, you can use the y-intercept to calculate the equation of a line. To do this, you need to know the slope of the line, as well as the y-intercept. The equation of the line can then be calculated using the y=mx+b format, where m is the slope, b is the y-intercept, and x and y are the x-values and y-values of the line, respectively.
What are some other uses for the y-intercept?
The y-intercept can be used to calculate the equation of a line, as mentioned above. It can also be used to determine the value of y when x is 0, or to compare the different slopes of two lines. Additionally, the y-intercept can be used to calculate the distance between two points on a graph.
Finding the y intercept can be a complicated process, but Excel makes it much easier. With its powerful tools, you can quickly and accurately find the y intercept of a given line or equation. With a little practice and patience, you too can become a pro at finding the y intercept in Excel. So why wait? Get started today and make finding the y intercept easier than ever.


