


How to Standard Deviation in Excel?

Are you looking for a step-by-step guide on how to calculate the Standard Deviation in Excel? As a professional writer, I understand the importance of learning data analysis tools and techniques to help you analyze data and make informed decisions. In this article, I will be guiding you through a comprehensive process of calculating Standard Deviation in Excel. We will also discuss the importance of Standard Deviation and how it can be used to measure the variability of a data set. So, let’s get started!
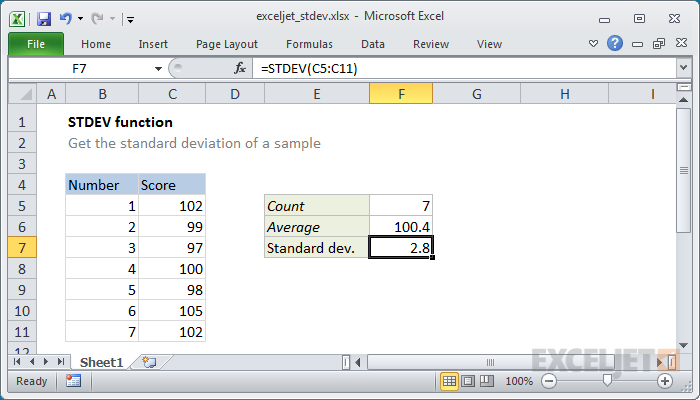
Standard Deviation in Excel is easy to calculate. Use the STDEV.P function to calculate the standard deviation of a given set of numbers. You can also use the Data Analysis Toolpack to find the standard deviation of a range of numbers. To calculate the standard deviation of a sample, use the STDEV.S function. The arguments for the STDEV.S function can be numbers, names, arrays, or references that contain numbers.
Step-by-step tutorial:
- Open Microsoft Excel.
- Enter the data into a column.
- Select the cell containing the data.
- Click the ‘Formulas’ tab.
- Choose the ‘STDEV.P’ function.
- Input the range of cells containing the data.
- Press enter to calculate the standard deviation.
Introduction to Standard Deviation in Excel
Standard Deviation is a mathematical function used to measure the spread of a data set. It is an important tool for measuring the variability of a data set. It is used to measure the degree to which values in a data set are dispersed from the mean or average. Standard Deviation can help you understand the variation in a data set, and it can help you make decisions about how to use the data. Excel is a powerful tool for calculating the standard deviation of a data set. In this article, we’ll discuss how to calculate standard deviation in Excel.
Calculating Standard Deviation in Excel
Calculating standard deviation in Excel is easy and straightforward. All you need to do is enter the data set into a worksheet and then use the STDEV function to calculate the standard deviation. First, select the data range that you want to use to calculate the standard deviation. Next, enter the STDEV function into the formula bar. The STDEV function will return the standard deviation of the data set.
There are a few different ways to calculate standard deviation in Excel. You can use the STDEV.S function, which returns the standard deviation of a sample, or the STDEV.P function, which returns the standard deviation of a population. You can also use the Data Analysis tool, which will calculate the standard deviation for a data set.
Using the STDEV.S function
The STDEV.S function is used to calculate the standard deviation of a sample. To use the STDEV.S function, select the data range that you want to use for the calculation and then enter the STDEV.S function into the formula bar. The STDEV.S function will return the standard deviation of the sample.
Using the STDEV.P function
The STDEV.P function is used to calculate the standard deviation of a population. To use the STDEV.P function, select the data range that you want to use for the calculation and then enter the STDEV.P function into the formula bar. The STDEV.P function will return the standard deviation of the population.
Using the Data Analysis Tool
The Data Analysis tool in Excel can be used to calculate the standard deviation of a data set. To use the Data Analysis tool, select the data range that you want to use for the calculation and then select the Data Analysis tool from the Data tab. The Data Analysis tool will open a window with several options. Select the Descriptive Statistics option and then select the Standard Deviation option. The Data Analysis tool will calculate the standard deviation of the data set.
Interpreting Standard Deviation in Excel
Once you have calculated the standard deviation in Excel, you can use the results to interpret the data set. The standard deviation measures the degree to which values in a data set are dispersed from the mean or average. A low standard deviation indicates that the values in the data set are close to the mean, while a high standard deviation indicates that the values in the data set are dispersed from the mean.
Measuring Variability
Standard deviation can be used to measure the variability of a data set. If the standard deviation is low, then the data set is not very variable. If the standard deviation is high, then the data set is more variable.
Making Decisions
Standard deviation can also be used to make decisions about how to use a data set. If the standard deviation is low, then the data set may be more reliable and trustworthy. If the standard deviation is high, then the data set may be less reliable and trustworthy.
Frequently Asked Questions
What is Standard Deviation?
Standard deviation is a statistical measure of the amount of variation or dispersion of a set of data values from the mean. It is calculated by taking the square root of the variance, which is the average of the squared differences from the mean. The formula for standard deviation is:
σ = √
where x is each data value, μ is the mean of the data set, and n is the number of data values in the set.
How to Calculate Standard Deviation in Excel?
Standard deviation can be calculated in Excel using the STDEV.P function, which is located in the statistical functions category. To calculate standard deviation, enter the following formula into a blank cell:
=STDEV.P(data set)
where data set is a range of cells containing the data set for which you want to calculate the standard deviation. For example, if your data set is in cells A1 to A10, you would enter the following formula into a blank cell:
=STDEV.P(A1:A10)
What is the STDEV.P Function?
The STDEV.P function is a statistical function in Excel that is used to calculate the standard deviation of a population. This function takes a range of cells as an argument and returns the standard deviation of the values in that range. It is important to note that the STDEV.P function calculates the standard deviation of an entire population, not just a sample.
How to Interpret Standard Deviation in Excel?
Interpreting standard deviation in Excel requires an understanding of the concept of standard deviation. Standard deviation is a measure of the spread of data around the mean. The larger the standard deviation, the more spread out the data is from the mean. A small standard deviation indicates that the data is relatively close to the mean, while a large standard deviation indicates that the data is more spread out.
What are the Uses of Standard Deviation in Excel?
Standard deviation is a useful tool for understanding the spread of data in a set. It can be used to identify outliers and to assess the variability of a data set. Standard deviation can also be used to compare different data sets and to make predictions about future data.
How to Calculate Standard Deviation of a Sample in Excel?
To calculate the standard deviation of a sample in Excel, you can use the STDEV.S function. This function takes a range of cells as an argument and returns the standard deviation of the sample. For example, if your data set is in cells A1 to A10, you would enter the following formula into a blank cell:
=STDEV.S(A1:A10)
It is important to note that the STDEV.S function calculates the standard deviation of a sample, not the whole population.
Standard Deviation in Excel (NEW VERSION IN DESCRIPTION)
Standard deviation is a great tool to measure the spread of a set of data. With Excel, it is easy to calculate the standard deviation of a set of data by using the STDEV.P function. Using this function will give you an accurate and precise measure of your data set’s spread. This can help in making informed decisions and better understanding the data. With the help of Excel, calculating the standard deviation of data is a quick and easy process.


