


How to Calculate Outliers in Excel?

For data analysts, the ability to accurately calculate outliers in Excel can be a powerful tool for making informed decisions. Outliers are values that are far from the average or mean of a data set, and learning how to calculate them in Excel can help you quickly identify data points that may require further investigation. In this article, we’ll explore how to calculate outliers in Excel, so you can use them to make more efficient decisions.
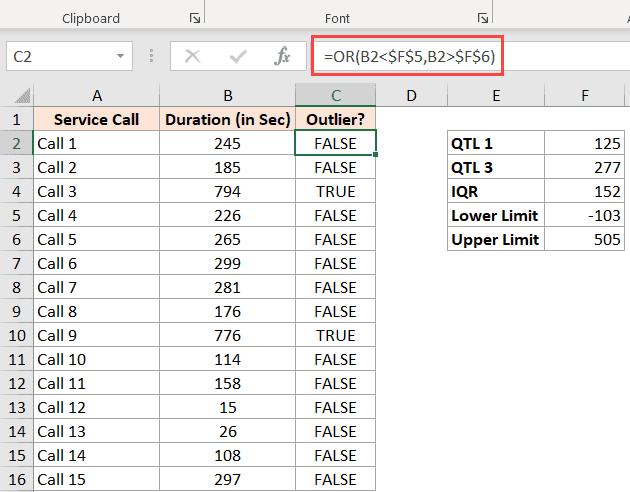
Outliers in Excel can be calculated using the Interquartile Range (IQR). To calculate the IQR, first calculate the first and third quartiles. Then calculate the IQR by subtracting the first quartile from the third quartile. Finally, calculate the upper and lower bounds of outliers by subtracting 1.5 times the IQR from the first quartile, and adding 1.5 times the IQR to the third quartile. Any values outside of this range will be considered outliers.
Here’s a step-by-step guide to calculate outliers in Excel:
- Open your Excel file and select the data you want to analyze.
- Go to the Data tab and select “Data Analysis”.
- Choose “Descriptive Statistics” and click OK.
- Select the Input Range, Output Range, and check the Summary Statistics box.
- Click OK and the summary statistics will appear in your Output Range.
- Calculate the first and third quartiles by dividing the number of data points by 4 and 3 respectively.
- Calculate the IQR by subtracting the first quartile from the third quartile.
- Calculate the upper and lower bounds of outliers by subtracting 1.5 times the IQR from the first quartile and adding 1.5 times the IQR to the third quartile.
- Values outside of this range will be considered outliers.
Calculating Outliers in Excel
Outliers are data points that are significantly different from the majority of the data points and can be used to identify trends, patterns, and other insights in a dataset. Excel is a powerful tool for analyzing data and finding outliers. In this article, we will discuss how to calculate outliers in Excel and how to use them to analyze data.
What Are Outliers?
Outliers are data points that are significantly different from other data points in a dataset. They are usually caused by errors in the data collection process, but they can also be caused by natural variations in the data. Outliers can be used to identify trends, patterns, and other insights in a dataset.
How to Calculate Outliers in Excel?
Calculating outliers in Excel is fairly straightforward. The first step is to calculate the median and interquartile range (IQR) of the data set. The median is the middle value in a dataset and the IQR is the range of values between the lower quartile and the upper quartile. Once the median and IQR have been calculated, outliers can be identified by comparing the values to the median and IQR. Values that are more than 1.5 times the IQR above the median or below the median are considered outliers.
How to Use Outliers to Analyze Data
Outliers can be used to identify trends, patterns, and other insights in a dataset. For example, if a dataset has a large number of outliers, this could indicate that there is a trend or pattern in the data. Outliers can also be used to identify errors in the data collection process. If a large number of outliers are found, it could indicate that something went wrong in the data collection process.
How to Visualize Outliers in Excel
Once outliers have been identified in a dataset, they can be visualized in Excel using a box plot or a scatter plot. A box plot is a type of graph that displays the median, quartiles, and outliers in a dataset. A scatter plot is a type of graph that displays the individual data points in a dataset. Both of these types of graphs can be used to visualize outliers in a dataset.
How to Handle Outliers in Excel
Once outliers have been identified and visualized in Excel, the next step is to decide how to handle them. Outliers can be removed from the dataset or the data can be transformed to make the outliers less influential. If the outliers are caused by errors in the data collection process, they should be removed from the dataset. If the outliers are caused by natural variations in the data, the data can be transformed to make the outliers less influential.
How to Use Outliers in Statistical Analysis
Outliers can also be used in statistical analysis. Outliers can be used to identify potential errors in the data collection process or to identify trends or patterns in the data. When using outliers in statistical analysis, it is important to consider the outliers carefully and to make sure that they do not skew the results of the analysis.
Conclusion
In this article, we discussed how to calculate outliers in Excel and how to use them to analyze data. We also discussed how to visualize outliers in Excel and how to handle them. Finally, we discussed how to use outliers in statistical analysis. With the right tools and techniques, outliers can be used to identify errors, trends, patterns, and other insights in a dataset.
Frequently Asked Questions
What is an Outlier?
An outlier is a data point that is significantly different from the other data points in a dataset. Outliers can be caused by a variety of factors, such as measurement errors, data entry errors, or a shift in the data distribution. Outliers can have a significant impact on the analysis and interpretation of a dataset, and so it is important to identify and handle them properly.
What is the Best Method for Calculating Outliers?
The best method for calculating outliers depends on the type of data and the desired results. Generally speaking, there are two common methods for calculating outliers: the interquartile range (IQR) method and the standard deviation (SD) method. The IQR method is best suited for skewed data, while the SD method is better for normally distributed data.
How to Calculate Outliers in Excel?
Calculating outliers in Excel is relatively straightforward. To calculate the IQR, use the QUARTILE function to calculate the first and third quartiles (Q1 and Q3). Then subtract the first quartile from the third quartile to get the IQR. To calculate the SD, use the STDEV.P function. Finally, use the following formula to calculate the outliers: IF (value (Q3+1.5*IQR)) THEN “outlier” END IF.
What are the Benefits of Calculating Outliers?
Calculating outliers can help identify data points that are significantly different from the rest of the data. This can be useful for identifying potential data entry errors or other factors that could be skewing the data. It can also help to identify patterns in the data that may not be immediately apparent.
What are the Limitations of Calculating Outliers?
The main limitation of calculating outliers is that it is not always clear if the outlier is due to a data entry error or some other factor. Additionally, the IQR and SD methods may not be suitable for all types of data, and may not always be the best choice for identifying outliers.
What are Some Tips for Identifying Outliers?
When identifying outliers, it is important to look at the data visually to identify any potential outliers. Additionally, it is important to understand the context of the data and consider any potential factors that may be causing the outlier. Finally, it is important to use the appropriate method for calculating outliers based on the type of data and desired results.
How to Find Outliers with Excel
Calculating outliers in Excel can be a time consuming but important task. By following the steps outlined in this article, you can easily and accurately calculate outliers in Excel. Whether you are a data analyst or a student, learning how to calculate outliers in Excel can help you save time and enable you to make more informed decisions.
With the right knowledge and a few clicks of the mouse, you can quickly and accurately identify outliers in any dataset. Now that you know how to calculate outliers in Excel, you can be confident that your data is accurate and reliable.


