


How to Create a Summary Report in Excel?

Writing a summary report in Excel can be a time consuming process, but it doesn’t have to be. With the right tools and a few simple steps, anyone can create a well-presented summary report in Excel quickly and easily. In this article, we’ll provide a step-by-step guide to creating your own summary report in Excel, along with tips and tricks for getting the most out of the program. Whether you’re a novice or an experienced user, this guide will help you create a professional and visually appealing summary report in Excel.
Creating a Summary Report in Excel
Microsoft Excel is a powerful spreadsheet software program that is used for data analysis, data visualization, and data management. With Excel, users can easily create summary reports that show a snapshot of their data. This article will provide step-by-step instructions on how to create a summary report in Excel.
Create Summary Table
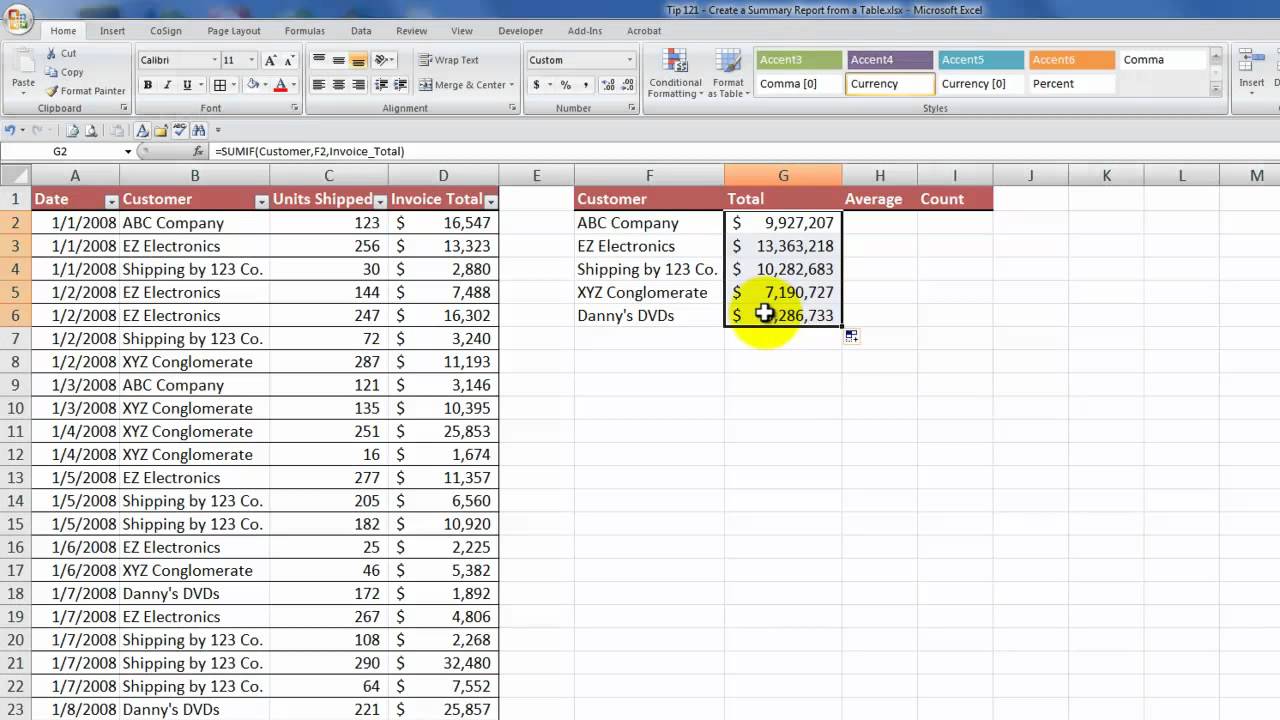
The first step in creating a summary report in Excel is to create a summary table. This table will contain the data that you want to summarize. To do this, open a new Excel worksheet and enter the data into the table. Make sure that all of the columns are labeled and that the data is properly formatted.
The next step is to specify the fields that you want to summarize. To do this, select the data that you want to summarize and then click the “Pivot Table” button in the “Data” tab of the ribbon. This will open the “Create Pivot Table” dialog box. In this dialog box, select the table that contains the data that you want to summarize and then click “OK”.
Format Summary Table
Once the Pivot Table has been created, the next step is to format the summary table. To do this, select the “Design” tab of the ribbon. Here, you can select various options to customize the look and feel of the summary table. For example, you can change the color of the table, add a background image, and customize the font.
Add Calculations to Summary Table
The next step is to add calculations to the summary table. To do this, select the “Formulas” tab of the ribbon. Here, you can select from a variety of formulas to calculate things such as totals, averages, and other summary metrics. Once you have selected the formulas that you want to use, click “OK” to add them to the summary table.
Add Chart to Summary Table
The final step is to add a chart to the summary table. To do this, select the “Charts” tab of the ribbon. Here, you can select from a variety of chart types such as pie charts, bar charts, and line charts. Once you have selected the chart type that you want to use, click “OK” to add it to the summary table.
Share Summary Report
Once the summary report is complete, the next step is to share it with others. To do this, select the “Share” tab of the ribbon. Here, you can select from a variety of options to share the report with others. For example, you can save the report as a PDF, export it to a cloud storage service, or email it to others.
Protect Summary Report
If you want to ensure that the summary report is secure, you can add a password to the report. To do this, select the “Protect” tab of the ribbon. Here, you can select from a variety of options to secure the report. For example, you can add a password to prevent others from accessing the report, or you can restrict editing privileges.
Conclusion
Creating a summary report in Excel is a great way to quickly analyze and visualize data. By following the steps outlined above, you can easily create a summary report in Excel.
Top 6 Frequently Asked Questions
What is a Summary Report in Excel?
A Summary Report in Excel is a way to present data in an organized and concise way. It can include charts and tables, as well as text to provide a high-level overview of the data. Summary Reports are useful for making quick decisions, or for presenting data to others.
How do I Create a Summary Report in Excel?
Creating a Summary Report in Excel requires several steps. First, select the data you want to include in the report. Next, organize the data into charts, tables, and text. Finally, format the report to make it easy to read and understand.
What Formatting Options are Available for Summary Reports in Excel?
When creating a Summary Report in Excel, there are many formatting options available. These include changing font sizes and colors, adding borders and backgrounds, and adjusting column widths and row heights. You can also add graphic elements such as images and text boxes.
What are the Benefits of Creating a Summary Report in Excel?
Creating a Summary Report in Excel provides several benefits. It allows you to quickly and easily organize and present data in a concise manner. It also provides a way to quickly make decisions, or to present data to others. Finally, it allows for advanced formatting options to make the report easier to read and understand.
What Tools are Needed to Create a Summary Report in Excel?
Creating a Summary Report in Excel requires the use of several tools. These include Excel itself, which is used to select and organize the data. It also requires the use of the formatting tools, which allow you to adjust the look and feel of the report. Finally, it requires the use of graphic elements such as images and text boxes.
Are There Any Tips for Creating a Summary Report in Excel?
When creating a Summary Report in Excel, there are several tips to keep in mind. One is to keep the report simple and concise. Another is to use the formatting options to make the report easier to read and understand. Finally, use graphic elements such as images and text boxes to add visual appeal to the report.
How to make Summary Report in Excel within 2 minutes, How to Summarize Data in Excel
Creating a summary report in Excel is an incredibly useful tool for businesses, especially when data analysis is essential. A summary report allows the user to quickly and easily view the most important information from a large dataset. With a few clicks, users can quickly gain valuable insights about their business and make informed decisions. With the help of this guide, you can now easily create a summary report in Excel and analyze your data with confidence.


